
modelDebug
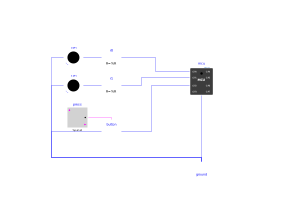
Extends from Modelica.Icons.Example (Icon for runnable examples).
Information
The simulation waits for VS Code (debugEnabled = true): the log shows Debugger: waiting for VS Code on port 5678. In VS Code, open Resources/Scripts/MCU/debug_demo.py, put a breakpoint, then Run and Debug > attach to localhost:5678 (configuration given in the user guide, page Debugging). The program then runs, stops on the breakpoint, and can be stepped; the variables (count, presses) are shown by VS Code. While the program is paused, the simulation waits: simulated time is frozen, the results are the same as without the debugger.
Expected result: led0 toggles every 100 ms during 2 s, led1 every 250 ms (timer callback); the button is pressed between t = 0.8 s and t = 1.2 s, so the log reports 4 loops with the button pressed.
Components
| Type | Name | Default | Description |
|---|---|---|---|
| MCU | mcu | scriptPath = Resources/Scripts/MCU/debug_demo.py, debugEnabled = true (tab Debugging): waits for VS Code on port 5678 | |
| Modelica.Electrical.Analog.Basic.Ground | ground | ||
| Modelica.Electrical.Analog.Basic.Resistor | r0 | limits the current of led0 (GP0) | |
| MicroPythonMCU.Peripherals.LED | led0 | GP0: toggled by the main loop | |
| Modelica.Electrical.Analog.Basic.Resistor | r1 | limits the current of led1 (GP1) | |
| MicroPythonMCU.Peripherals.LED | led1 | GP1: toggled by the timer callback | |
| Modelica.Electrical.Analog.Ideal.IdealClosingSwitch | button | pressed between t = 0.8 s and t = 1.2 s: pulls GP2 to ground (internal pull-up) | |
| Modelica.Blocks.Sources.BooleanPulse | press | button pressed from 0.8 s to 1.2 s |